Data is a mess. It's a sprawling, confusing jumble. It sprawls across different platforms and comes in all shapes and sizes. It throws challenges and gives you a headache. But we can't escape it - it's the fuel that powers our businesses.
Yes, right now, your data might look like a teenager's bedroom – a little chaotic, not making much sense. But don't be fooled. There's a goldmine in there.
That’s where data analytics steps in. Like a top-class detective, it sorts through the mess, finds patterns, and gives you answers. It turns your jumbled data into something valuable.
But here comes another snag – picking the right data analytics tool. It's like wading through a jungle of legalese and tech jargon. Don't worry, I’m not here to add to the confusion.
This guide is your trusty flashlight in the murky world of data analytics solutions. Following our discussion on features, budgets, and ease of use, we'll help you find your path. One step at a time, one decision at a time.
So, let's dive in, shall we? Let’s find that perfect tool which can turn your data mess into success!
Understanding Data Analytics
We swim in a sea of data. From messages on our phones to news updates, statistics we see in work presentations, fitness stats on smartwatches – data is everywhere. But what does 'data' really mean?
At its core, 'data' is simply information. And 'data analytics'? It's a way to make sense of that information.
Data analytics uses specialized systems and software to take in data, process it, and then create reasoned and relevant conclusions. For a business, this often means taking raw data sets – like sales figures or website traffic – and turning them into insights that guide decision-making.
Imagine a bakery wanting to know which products are the most popular. They could use data analytics. By collecting sales data, they could see that chocolate muffins are best-sellers while strawberry doughnuts barely leave the shelf. Through this simple form of data analytics, the bakery gains insights useful for future decision-making.
In a more complex business world, data analytics takes up many forms. It might help a company understand buying behavior of customers. Or, it could assist in predicting future trends, saving a company from risks, and guiding its growth.
Data analytics isn’t about complex math or technology, even though those are the tools that help us do it. It’s all about understanding. It's about making smarter decisions. It's about gaining the necessary wisdom from our sea of data.
And today, there are several tools available that help in data analytics. Power BI is one of them. But how does it compare to other solutions? Let's discuss that next.
Exploring Power BI
Alright, let’s dive into Power BI.
Power BI is a tool that lets you take all that raw data you have and turn it into easy-to-digest visuals. Picture this: instead of columns of numbers, you get colorful charts and graphs that show you what's up at a glance.
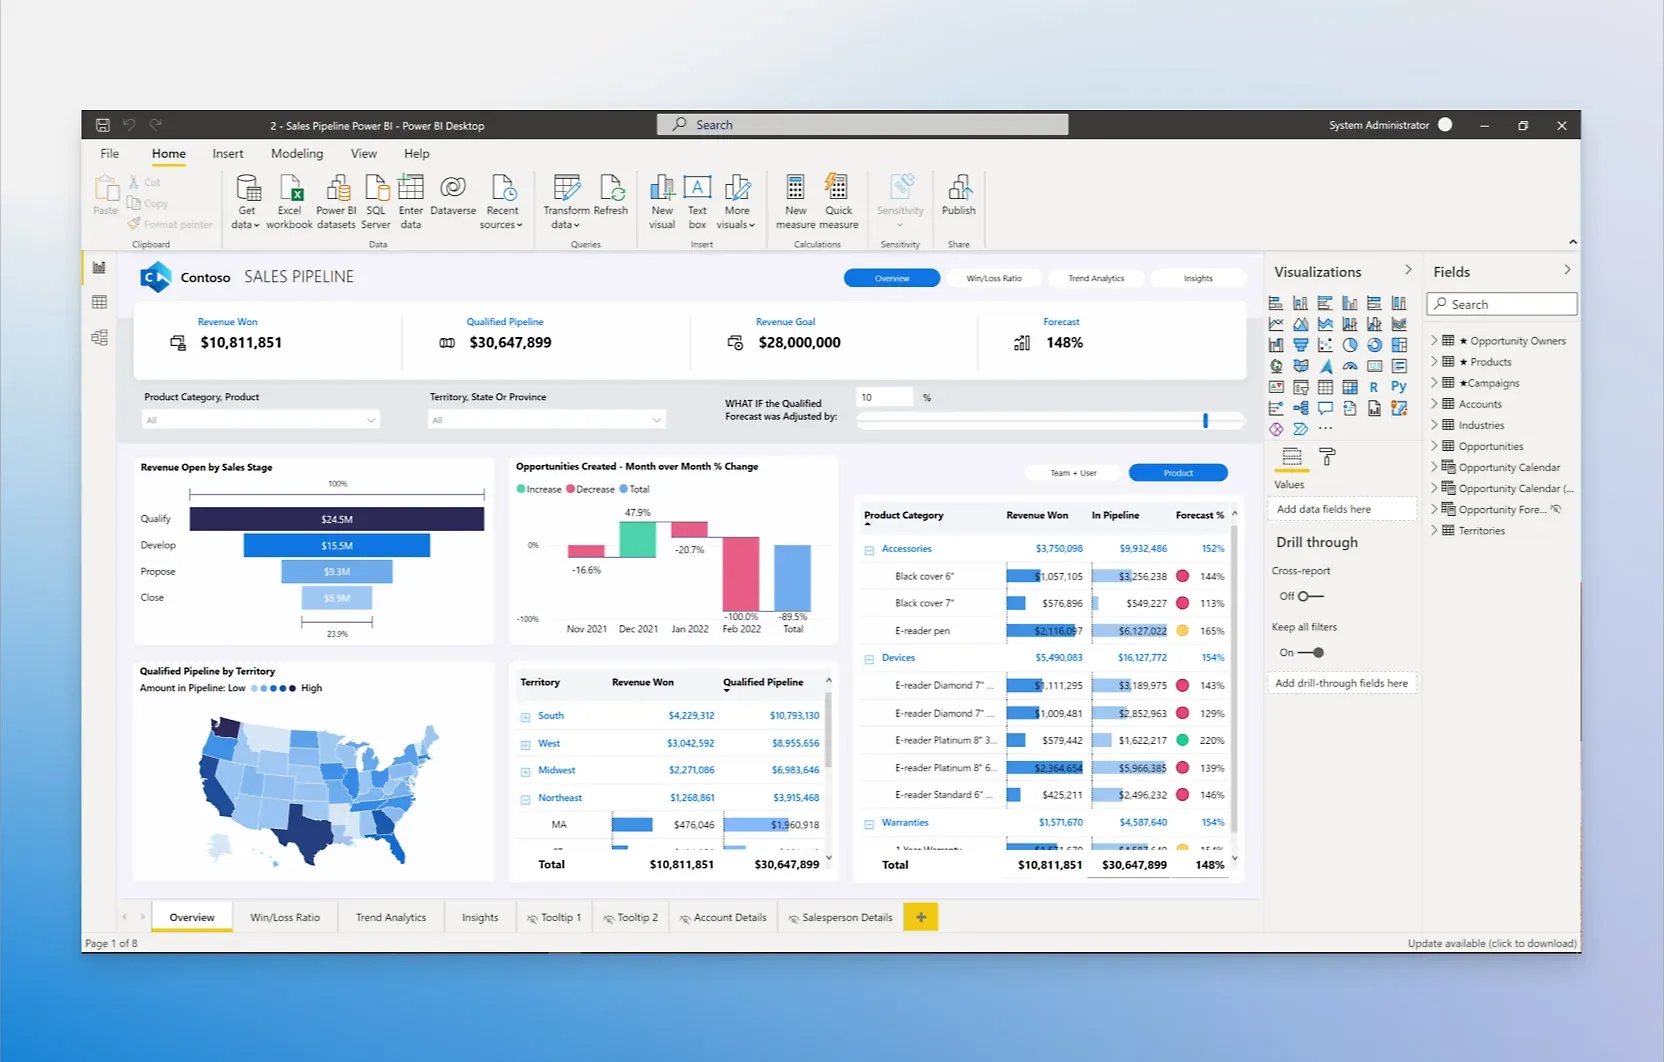
It’s made by Microsoft, which means it plays really well with other Microsoft products like Excel and Azure. If you’re already using Microsoft stuff at work, Power BI can slide right into your setup without much fuss.
One of the best things about Power BI is its ability to pull in data from lots of places. You can take information from your sales system, your website traffic tool, even a social media feed, and see it all together. This makes it super simple to spot trends or issues across different parts of your business.
Another cool part? Power BI is pretty user-friendly. You don’t need to be a data scientist to make it work. With some basic training, most people can start creating reports that actually tell you something meaningful.
But it’s not just about making pretty charts. Power BI lets you dig deep. You can ask questions in plain English (like "what were my best-selling products last month?") and get answers right away. It also has some advanced analytics features, so if you do have data experts on your team, they can really get into the nitty-gritty.
And pricing? There’s a free version that’s pretty robust for individual users. Businesses can go for the paid versions, which add more collaboration and security features.
In short, Power BI is all about making data understandable and actionable. Whether you’re a one-person show or part of a big company, it offers a lot of value in seeing the bigger picture and making smart decisions.
Suggested Reading-
Exploring Other Data Analytics Solutions
Now let's look beyond Power BI.
There's a bunch of other tools in the data analytics garden. Tableau, QlikView, and Google Data Studio are just a few popular ones. Like different flavors of ice cream, they each have their own fans.
Tableau stands out with its powerful ability to turn complex data into approachable visual stories.
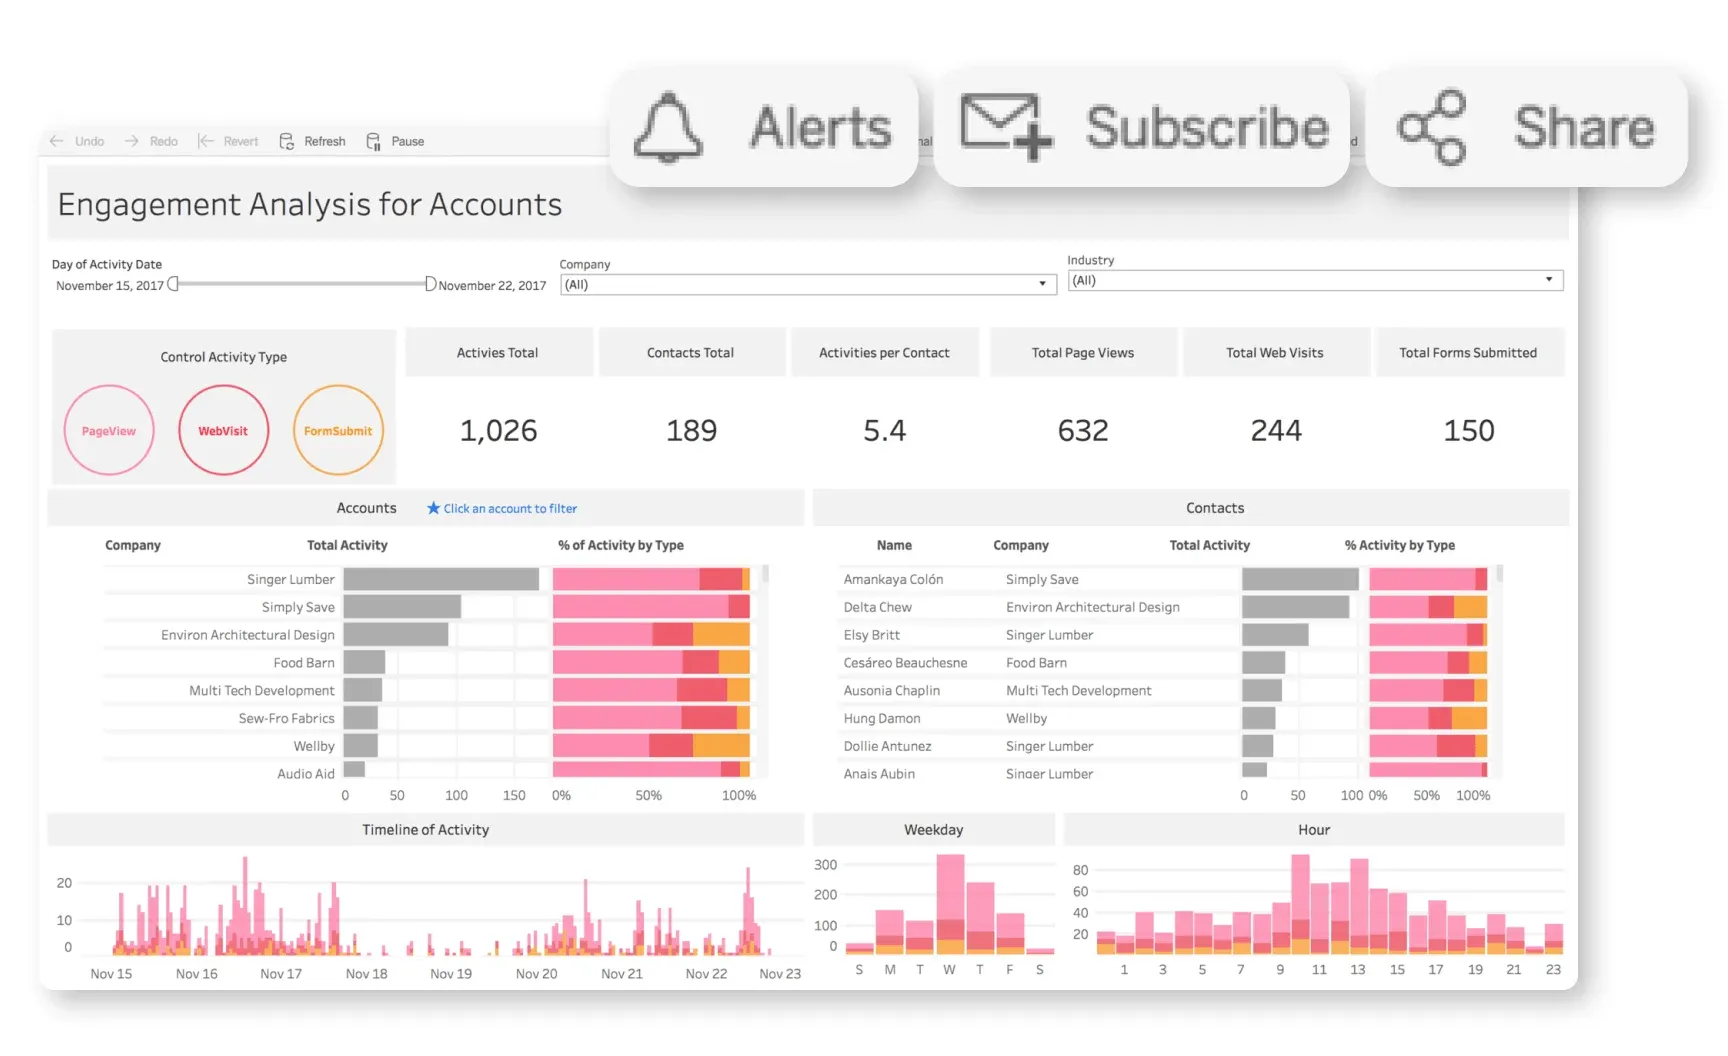
If you're into dragging and dropping to create impressive charts and interactive dashboards, this one's for you.
It's big among professionals who need deep, data-driven insights, though casual users might find it a bit hefty at first.
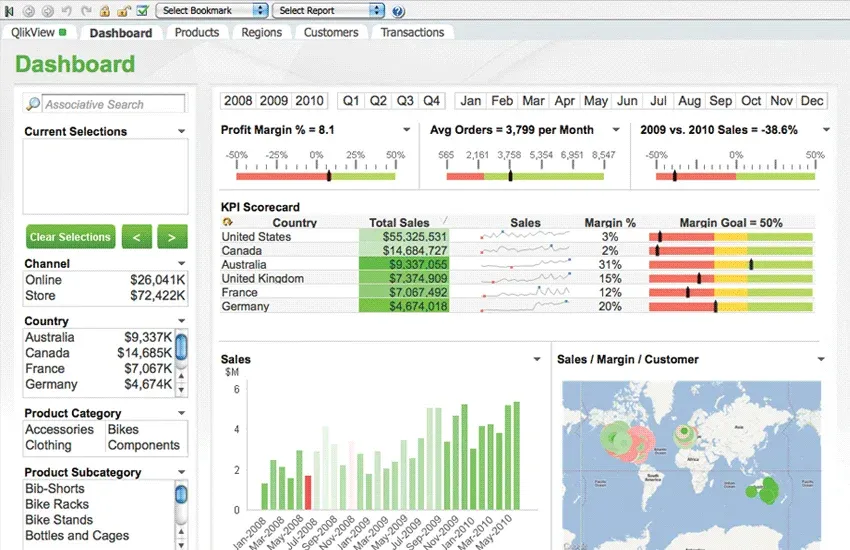
QlikView offers something different — its own unique way of compressing data and finding connections instantly.
It's for those who love to play detective with their data, following leads and uncovering hidden trends.
And speed is a big deal here; QlikView moves fast, delivering answers quickly.
Then there's Google's take – Google Data Studio. It plays nice with other Google services (think Analytics or Sheets). If you're tight on budget, you'll be happy to know it’s free.
Data Studio is all about creating and sharing customizable reports and dashboards online.
It might not be as rich in features as the others, but it's straightforward and does the job well for basic reporting tasks.
There's one truth for all these tools: they help you see the data's story. But they all tell it in their own way. Some are more about the visuals, some about speed, others are more about depth.
Keep this in mind: no tool is the 'best' for everyone. The best one for you depends on what your business needs. Your team's skill level, and your budget also play big parts in picking your data analytics friend.
Comparison Between Power BI and Other Data Analytics Solutions
Choosing the right data analytics tool is a bit like picking out a car. You need one that fits your style, meets your needs, and stays within your budget. Let’s take a quick look at how Power BI stacks up against other options out there.
Feature | Power BI | Tableau | QlikView | Google Data Studio |
| Ease of Use | User-friendly, intuitive | Steeper learning curve | Flexible with a learning curve | Very user-friendly |
| Integration | Excellent with Microsoft products | Good, broad range | Good, especially with in-house data | Great with Google services |
| Data Handling | High | Very high | High | Moderate |
| Customization | High | Very high | Very high | Moderate |
| Real-time Analysis | Yes | Yes | Yes | Yes, but limited |
| Collaboration Features | Good, better in paid versions | Excellent | Good | Good |
| Cost | Free version available, paid upgrades | Subscription-based | License purchase required | Free |
Remember, there's no one-size-fits-all. Think about what you really need. Do you value ease of use and are already using lots of Microsoft products? Maybe Power BI is your ticket. Need the deepest insights and don’t mind a learning curve? Tableau could be your champion. Is budget a big concern and you’re using Google products? Google Data Studio might just be enough.
Each tool has its own strengths. Match those strengths with what's most important for you and your team, and you're golden.
How to Choose the Right Data Analytics Solution?
Picking the best data analytics tool is like choosing the perfect running shoes. It's got to fit just right. Here’s what to consider without getting into the tech talk.
First, think about what you’re going to use it for. Are you tracking website visitors, sales numbers, or social media stats? Make sure the tool you pick can handle your specific data without a hitch.
Next, who's going to use this tool? If it’s just you, go for simplicity. If you've got a team, consider what they know how to use already. No point getting something that'll make everyone scratch their heads.
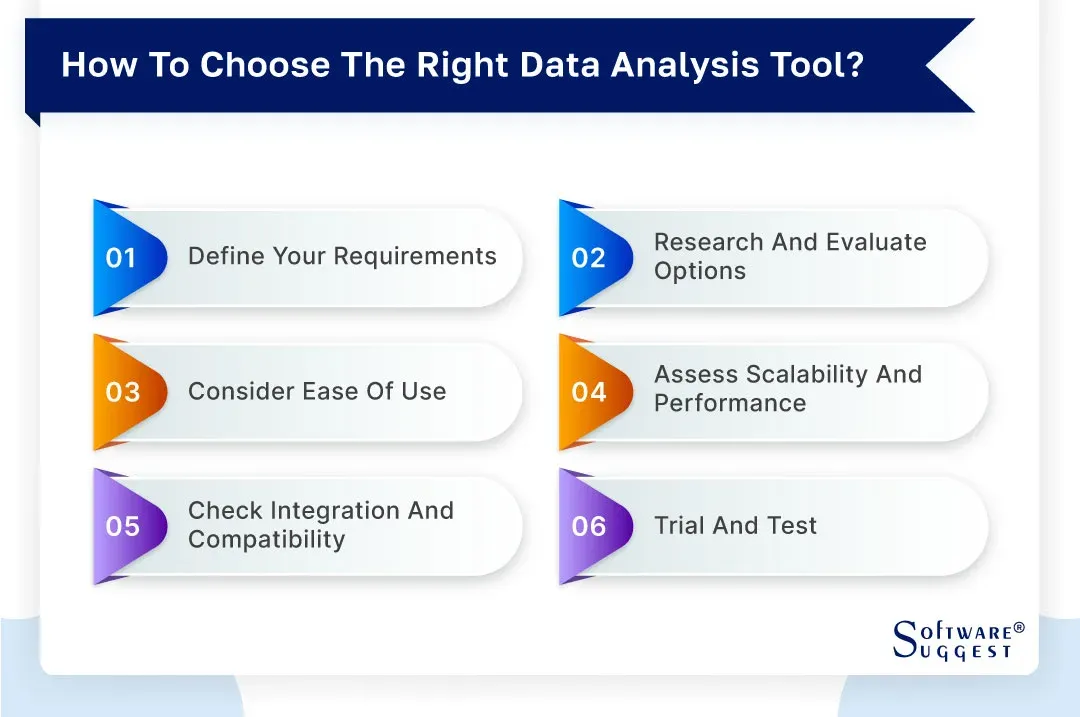
Then, there's money. Some tools are free, but they might not do everything you want. Others make you reach deep into your pockets but they come with all the bells and whistles. Figure out your budget and find a balance.
And don't forget about the future. Your business will grow (that's the plan, right?), so you need a tool that’s going to grow with you. Think about what you’ll need in a year or two, not just today.
Integration is another big one. If you're all about Microsoft, a tool like Power BI might slide in easily. If you're more into Google, Data Studio could be a better pal.
Last but not least, take them for a test drive. Most tools have free trials. Play with them, throw in some real data, and see what feels right. It's like trying on those running shoes and taking a lap around the store.
Choosing the right data analytics solution doesn’t have to be fancy or complicated. Keep it simple and make sure it’s a good fit for you and where you’re headed. That’s it.
Conclusion
Alright, we've looked at different tools, checked out their features, and talked about how to pick the right one. It's a lot like shopping for the right tool to fix stuff - you need the right fit for the job.
Keep in mind, your choice should fit your current needs, but also think ahead. Where is your business going? Make sure your pick can journey with you as you grow. And yes, budgets are important, but so is ease of use and integration with what you already have.
In the end, test drive before you buy. Just like you wouldn't buy a car without driving it, don't pick a tool without trying it out. Get your hands on it, play around, and see how it feels. That's the best way to know you've made the right choice.
Suggested Reading-
Frequently Asked Questions (FAQs)
Can I switch data analytics tools easily if I find a better one later?
Switching tools can be done, but it’s not always a walk in the park. It depends on how your data is stored, the compatibility between the tools, and the learning curve for the new tool.
How important is customer support for a data analytics tool?
Very important. Even the most intuitive tool can have nuances or issues you'll need help with.
Solid customer support can save you hours of frustration.
Do I need a team to effectively use these tools, or can I manage alone?
It depends on the scale and complexity of your data. Individuals can effectively use simpler tools, but a team might be necessary for more complex analytics.
Is there a significant difference between free and paid versions of data analytics tools?
Yes, paid versions usually offer more features, greater data handling capabilities, and better customer support.
However, free versions can be sufficient for basic needs or small-scale operations.
