Data's boring. That's it - unless you're a number-crunching nerd, data probably sends you to sleep. Sheets upon sheets of numbers, percentages, ratios - it's like staring at hieroglyphics.
But what if it didn't? Imagine if those spreadsheets transformed into visuals; beautiful, simplistic graphs and charts. Doesn't that spark your interest a bit more?
This isn't some hypothetical scenario. It's real and it's right here with us. Say hello to Microsoft's answer to your data dilemmas - Powerbi. It's a tool designed to make your data come alive, not just in your desktop, but also on your mobile.
Surely, you've heard about Powerbi before. Maybe you've brushed it aside thinking it was too complicated. "I'm not a data scientist", you might've said. But wait! Powerbi doesn't necessitate a degree in statistics nor does it demand hours of coding.
Instead, it welcomes your curiosity. It takes your hand, leads you to dig deeper into your data, and uncovers hidden truths inside those boring excel sheets. Curious enough? Stick with us as we dive into some accessible, yet incredibly powerful features of Microsoft Power BI. Trust me, it's going to be a fun ride!
Step-by-step Guide to Install Microsoft Power BI
First up, you need to get Microsoft Power BI on your computer. Go to the official Powerbi website. Look for the “Download” section. You'll likely find it under the "Products" menu. Select the version you need, usually the one that matches your Windows.
Click "Download". It’s a pretty straightforward process – think of downloading any regular app. The installer file should land in your "Downloads" folder or wherever you set files to save.
Got the file? Great. Now, double-click on that installer. A new window pops up. It’s asking for a spot on your computer to live. Just stick with the recommended settings – they work just fine. Hit "Next", then "Install”.
You might see a prompt – it’s your computer’s way of checking if you’re okay with the changes. Click "Yes". This gives Microsoft BI the green light to start setting up shop.
Wait a bit. Watch the progress bar fill up. It’s installing. Shouldn't take long.
“Installation complete.” That's what you want to see. Click "Finish". Now, MS Power BI is all set up. Last thing – you need to tell Microsoft Power BI who you are. Open the program. A welcome screen will meet you.
Somewhere on that screen, there’s a spot to sign in. Already have a Microsoft account? Use it here. If not, no sweat – just make one. Follow the cues on the screen – fill in details, create a password, usual sign-up stuff.
Signed in? Congratulations! You’ve just installed Microsoft Power BI on your machine. Now, the real fun begins – using it to turn data into insights. But that’s another story, for another time. Get ready to dive into your data with Microsoft Power BI.
Suggested Reading:Step-by-Step Guide to Implementing Microsoft Power BI
Understanding the Power BI Interface
Alright, let's get to know Powerbi, the program you've just added to your computer. Open it up and you'll be welcomed by a screen, which might feel a little overwhelming at first sight. But hey, don't stress! It's simpler than it looks.
Think of the Microsoft Power BI interface as a playground. Different areas, lots of features, but all there for you to use. Sections include "Home", "View", "Modeling", and so on - they're all tabs sitting on the top ribbon. Keep them in mind. You'll be visiting these areas while working with Microsoft BI.
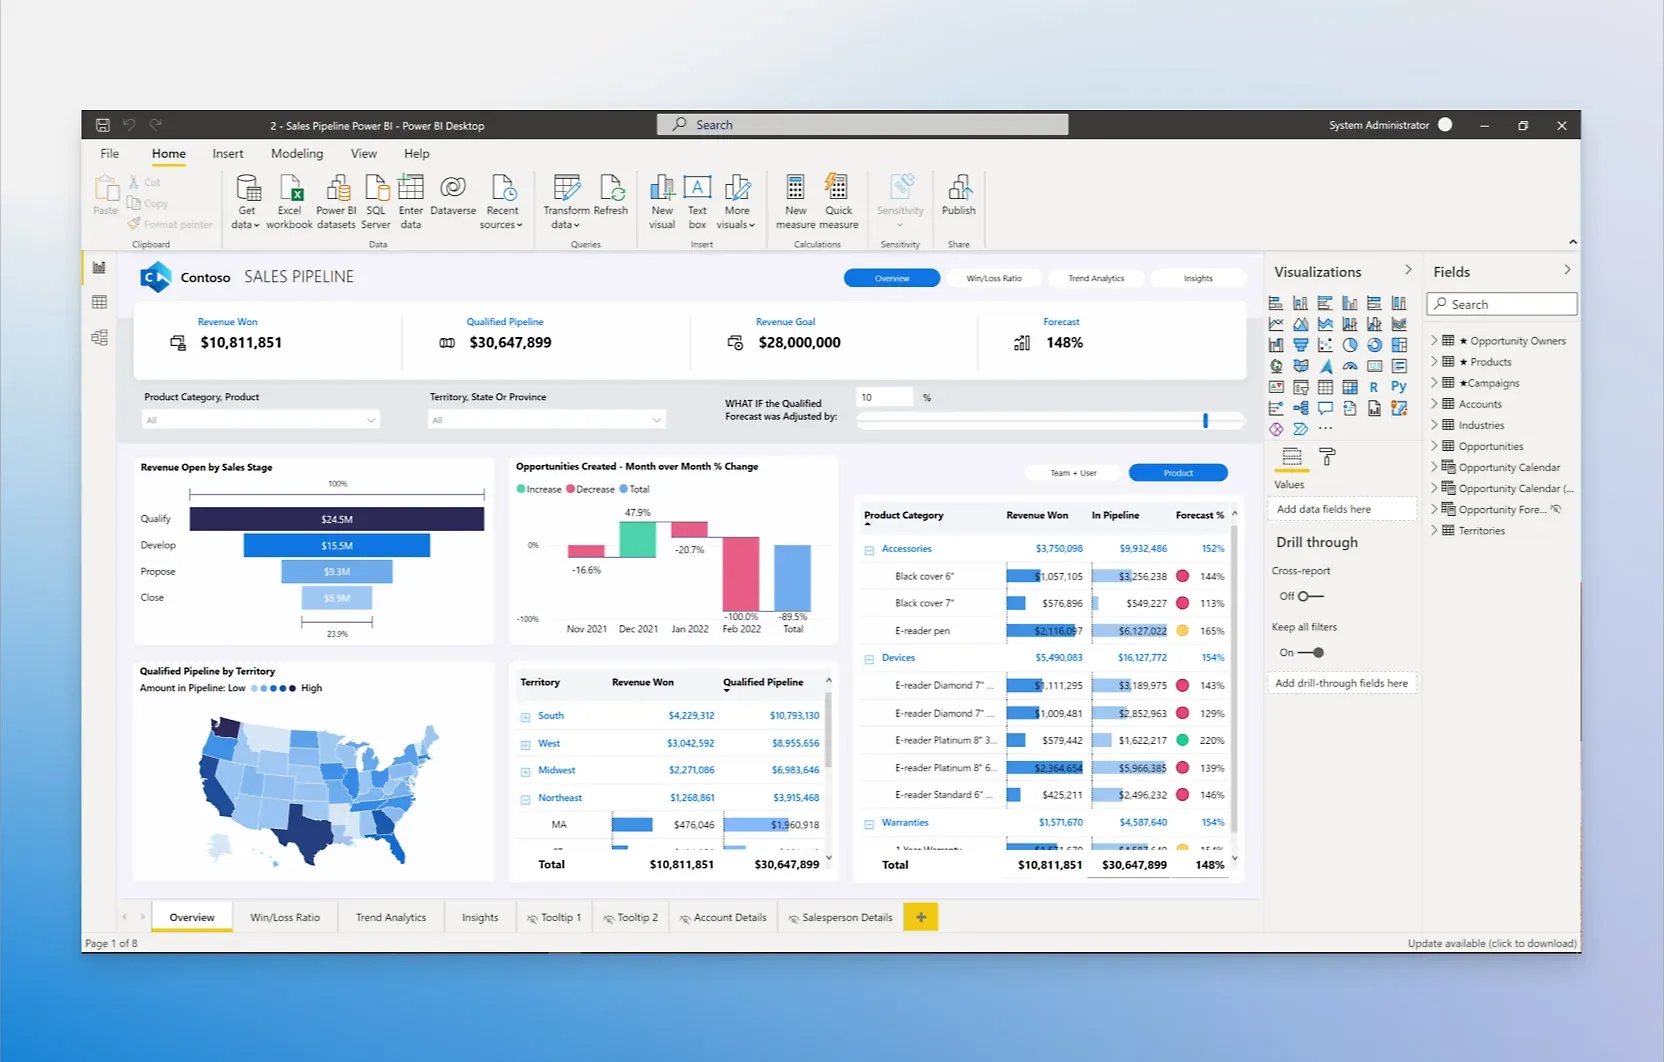
Now let's take a quick tour. We start at the "Home" tab. You'll likely spend a lot of time here. It's got everything you need to create a basic data report.
Underneath the top ribbon, you'll see a blank canvas. It's yours to populate with data. To its left, there's a sidebar with three symbols - report, data, and model. You can swap between them. It's here you work on visual elements, check raw data, and adjust the data's relationships.
Over to the right side, you'll see two panes. The first, called "Visualizations", is where you turn your data into something more... well, visual. Pie charts, graphs, maps, you name it - it's all here. The other, the "Fields" pane, is where you organise the elements of your data.
Remember, MS Power BI is a tool for you. Explore it. Play with it. It's designed to be intuitive. You can't break it. Well, you can, but there's always an "Undo" button.
So, relax. Take a deep dive into Powerbi's interface and before you know it, you'll be swimming with ease. Ready to move to the next step? We thought so. Let’s start using Microsoft Power BI by bringing data into this space.
Suggested Reading:Step-by-Step Guide to Implementing Microsoft Power BI
How to Implement Microsoft Power BI?
You've got Microsoft Power BI on your computer. You've toured the space. Now it's time for the main event - working with data. Here's how you do it.
- Get your data:
- Open Microsoft BI
- Click on "Get data" on the "Home" tab
- Select your data source and follow the cues
- Transfer data to canvas:
- Pull data fields from the "Fields" pane to the report canvas
- Create visuals:
- Go to the "Visualizations" pane
- Choose a visual type that fits your selected fields
- Drag fields onto the visual
- Make it interactive:
- Use slicers from "Visualizations" to allow user interactions
- Publish your report:
- Press "Publish" on the "Home" tab to upload your report to the Power BI service on the web
And that's it – the key steps to make a data report in Powerbi. Each step is crucial in implementing Microsoft Power BI effectively. Happy exploring!
Useful Power BI Features
So, you've figured out the basics of Powerbi. Now, let's dig a bit deeper and uncover some super useful features of Microsoft Power BI.
These aren't just bells and whistles. They're here to amplify your understanding of data.
Ready? Let's dive in.
1. Quick Insights
This is MS Power BI's little genius. It can instantly highlight interesting patterns in your data. Just right-click on a dataset and select "Quick Insights".
Microsoft BI will churn out a bunch of visuals about trends, correlations, outliers, and whatnot. It's like having a mini data scientist on demand.
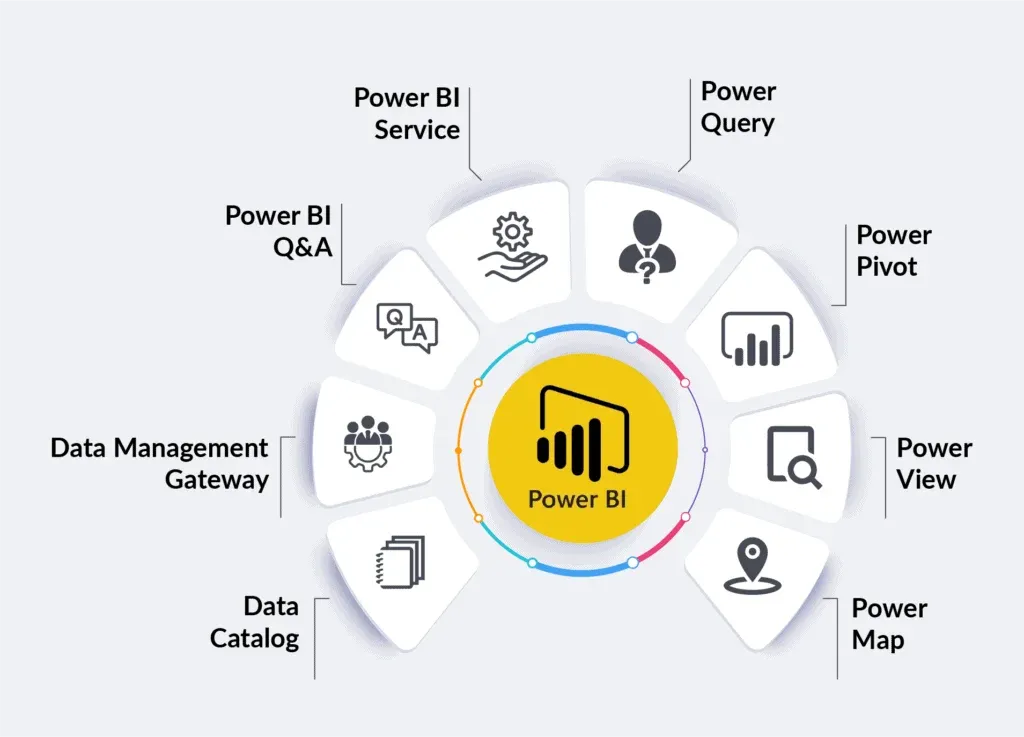
2. Power Query
Think of this as Microsoft Power BI's data wrangler.
Power Query fetches your data, and with a bit of instruction, it can clean it, transform it, merge it with other data - whatever you need.
Once you've manipulated your data, it remembers your actions. Need the same changes next time? Power Query will repeat them for you.
3. DAX (Data Analysis Expressions)
If you're serious about diving into Powerbi, you'll need to speak DAX. It's the formula language of Microsoft BI.
Think of it like a more powerful Excel. With DAX, you can create your own metrics or measures.
It helps you calculate, analyze and visualize data the way you want. It's a bit of a learning curve, but totally worth it.
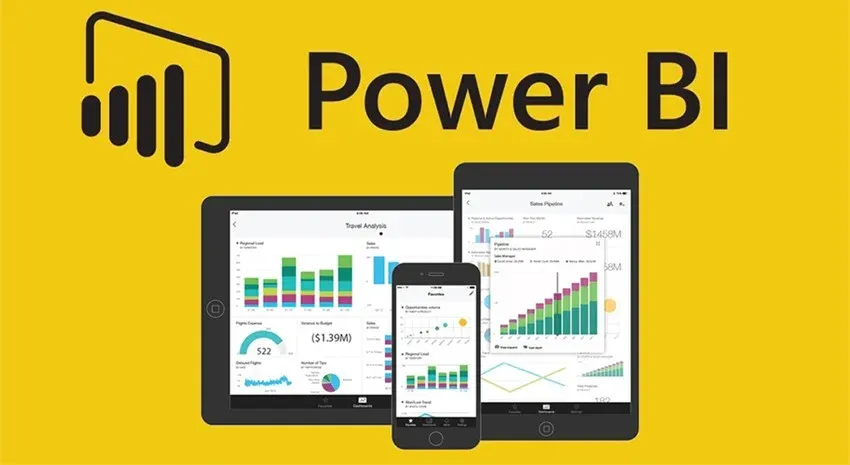
4. Power BI Mobile
Your data doesn't have to be stuck to your desk. Go mobile with Powerbi. There's an app for that!
The Power BI mobile app works on your phone or tablet. You can access your dashboards, reports and visuals anytime, anywhere.
5. Natural Language Query
Imagine if you could just ask your data questions like you’re talking to a person. With Microsoft Power BI, you can.
The Natural Language Query lets you input a question, and it finds the answer in your data for you. No more wrangling visuals and filters. Just ask.
6. Power BI Service
Share and collaborate on your Powerbi projects using Power BI service. It's your Microsoft BI workspace in the cloud.
You can publish your reports here, share them with others, or even collaborate on dashboards. You're no longer a lone data soldier. You're part of a data team.
7. Power BI Embedded
Let’s take it a step further and share your Powerbi reports and dashboards with your own app users. Meet Power BI Embedded. It's a service that lets you include Power BI visuals in your own apps or websites.
Your users won't even need a Microsoft Power BI license to see and interact with these.
There you have it. Seven of the best bells and whistles of MS Power BI. Remember, they're not there just for fun. They're tools. Use them to make your data work harder. The more you explore, the more you'll get from Powerbi.
Suggested Reading:Step-by-Step Guide to Implementing Microsoft Power BI
Conclusion
That's Powerbi for you in a nutshell. It's a tool that turns your mountain of data into accessible, understandable visuals. Yet, it's not just a pretty face. Its features like Quick Insights and Power Query mean you can crunch data without becoming a data scientist.
Diving into Microsoft Power BI doesn't mean you're chained to a desk either. The platform goes where you go, thanks to the mobile app. Powerful, portable, and loaded with potential, Microsoft BI could be your new data buddy.
So, don't shy away. Dive in, play around, and get comfortable. The more you experiment, the more you'll get out of MS Power BI. With these tips and guides in your arsenal, you're more than ready to start your Powerbi adventure.
Frequently Asked Questions (FAQs)
Can you integrate Microsoft Power BI with other business software?
Yes, Microsoft BI is all about integration. It can seamlessly plug into various other tools like Excel, SharePoint, Teams, and many others. Check out the "Get Data" options for a full list.
Does Powerbi deal with real-time data?
Absolutely, Powerbi is great with handling real-time data.
You can set up dashboards to refresh at specific intervals, giving you live insights into your business.
How secure is your data in Microsoft Power BI?
Microsoft takes data security seriously. Powerbi offers robust security measures, including row-level security and the option to classify and protect sensitive information.
There is also an additional layer of cloud security when using the Power BI service.
What kind of customer support you can expect with Microsoft BI?
Microsoft provides substantial support and resources for Powerbi users. It ranges from documentation and tutorials to user forums and dedicated support teams.
Plus, the Powerbi community is quite active and super helpful.
