Data is boring. Or so they say. It's often visualized as endless rows of numbers, lifeless charts, and eyes glazing over screens. But what if I told you that hidden in those numbers is a story waiting to be told? A story that can transform the very way we understand our business, our customers, and even our personal projects.
This revelation might seem counterintuitive. After all, how can something as mundane as data spark such dramatic change? Well, the secret lies not in the data itself, but in how we bring it to life. And that’s where Power BI steps into the spotlight.
Power BI turns the monotonous task of data analysis into a dynamic and engaging process. It’s like giving a painter a palette of colors to express their imagination. Suddenly, those endless rows of numbers transform into vivid, interactive visuals that tell a compelling story.
We're diving into the world of Power BI. We'll uncover its benefits, walk through common use cases, and guide you through getting started. And trust me, by the end of this journey, you’ll see data in a whole new light. Ready to get started?
What is Microsoft Power BI?
Microsoft Power BI is a tool that turns data into visual stories. Think of it as a super-powerful microscope that not only lets you see your data up close but also helps you understand what it's telling you. It's like having a translator for numbers, making them speak in charts and graphs instead of rows and columns.
Power BI is part of the whole Microsoft family, so it plays nice with tools like Excel and Azure.
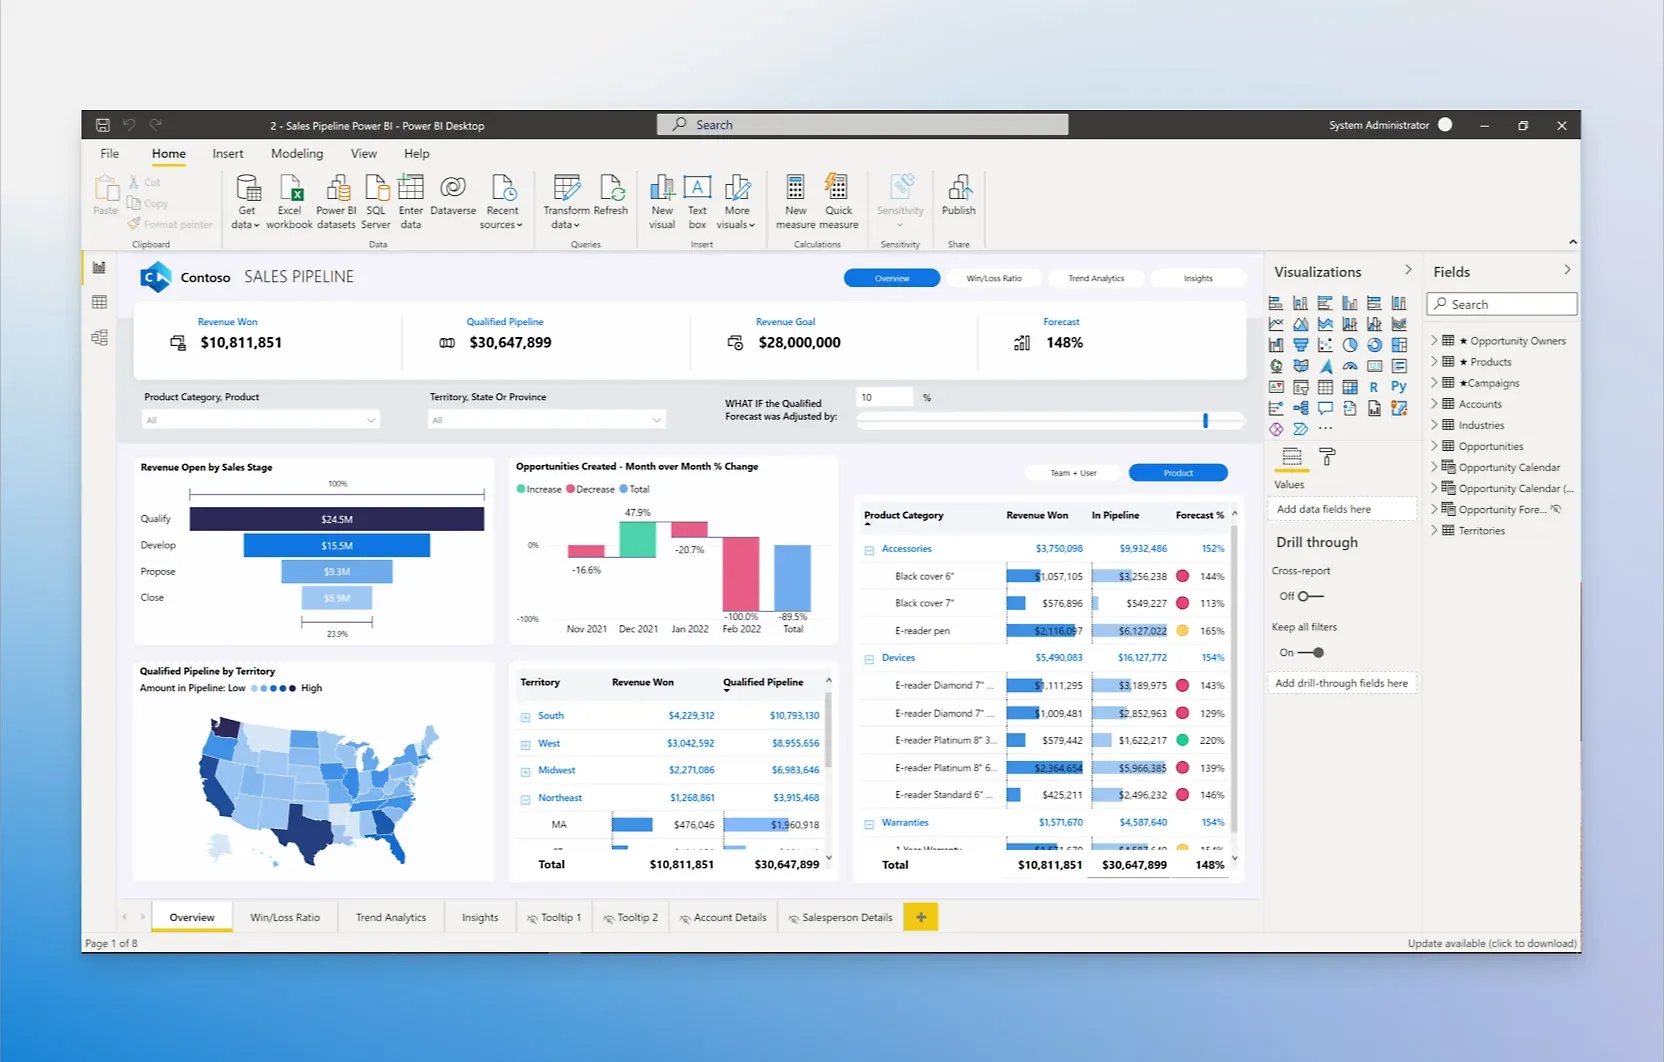
You can pull in all sorts of data, from sales figures to customer feedback, and see it all in one place. It’s like putting together a giant puzzle where every piece is a different bit of data, and Power BI helps you see the full picture.
What's cool is that you don't have to be a data scientist to use it. Whether you're running a business, managing projects, or just love numbers, Power BI gives you the power to dig into data and find the stories hidden there. It’s all about making informed decisions without getting lost in the details.
The Components of Power BI
Power BI isn't a single tool, but a toolkit built up of different parts. Here's a quick breakdown of its main components:
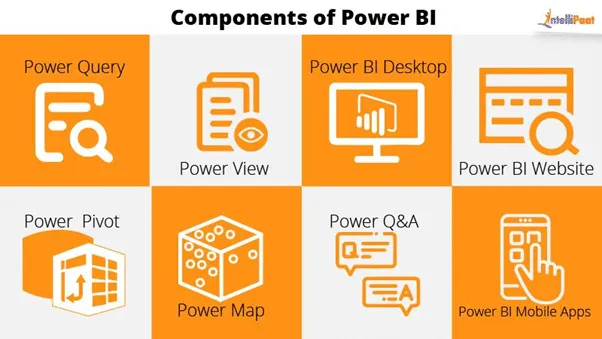
Start with Power BI Desktop. This is where you create reports and do most of your data "cooking". It's a bit like the kitchen for preparing your data meal. You mix your ingredients (data), chop and dice (clean and transform), and cook it all together to make a tasty dish (a cool visual report).
Moving on, we have the Power BI service, sometimes called Power BI online. It's like your data server, available through your web browser. It's where you publish the reports you made on Power BI Desktop so others can enjoy your data meals. You can also create dashboards here, which are like customizable menus displaying your tastiest dishes.
Power BI Mobile is the take-away version of Power BI service. It delivers your data meals straight to your smartphone or tablet, so you can keep on top of data wherever you are.
Underlying all these are datasets, reports, and dashboards. Datasets are your raw ingredients, a collection of related data that you import into Power BI.
Reports are collections of visuals, metrics, and other data that you create based on your datasets. And dashboards? They're collections of visuals, reports, and other data that you select and arrange, providing a consolidated view that's easy to understand and share.
In short, Power BI is made up of different components, each with its own role, all working together to give you a clear view of your data. It means you can create, share and view data the way it makes sense for you.
How Does Power BI Work?
So how exactly does Power BI work? The whole process is kind of like organizing a party.
First, you send out invitations, meaning you connect Power BI to the data you need. This data can come from all over – Excel spreadsheets, cloud services, streaming data, on-premises SQL Server databases, and more.
Power BI can handle all these different data types, and it's like getting RSVPs from all your guests.
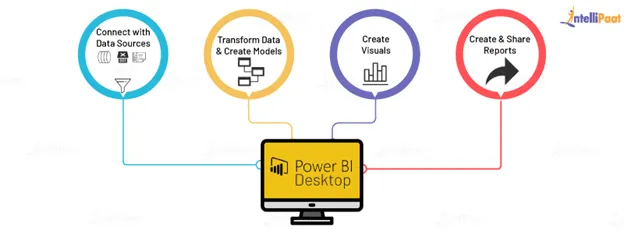
Next, you make a big master list of who's coming – this is like importing your data into Power BI. The tool will slurp up all this data, get everything organized, and drop it into a dataset, which is like your guest list.
Once you've got your data in one place, now comes the fun part: the party planning. This is where you start creating your reports. You can design graphs, charts, maps, and more visualizations. It's like deciding on the party decorations and what music to play.
But here's where it gets even better: Power BI doesn't just show your data, it also lets you interact with it. You can slice and dice your data and drill down to get more detailed information. This works like filtering party playlists based on the mood or theme.
And the final stage? This is where you publish your reports. It's like finally throwing the party and having a blast. You put all of your hard work with the data out there for other people to see. And with Power BI, you get to decide who you share it with.
So this is how Power BI works: from gathering and organizing data to creating reports and sharing insights, it's all about bringing your data to life.
Benefits of Using Power BI
Using Power BI comes with a bunch of cool benefits. For starters, it lets anyone become a data guru. You don’t need to be a tech whiz to make sense of complex data. Power BI simplifies it all, turning numbers into easy-to-read charts and graphs.
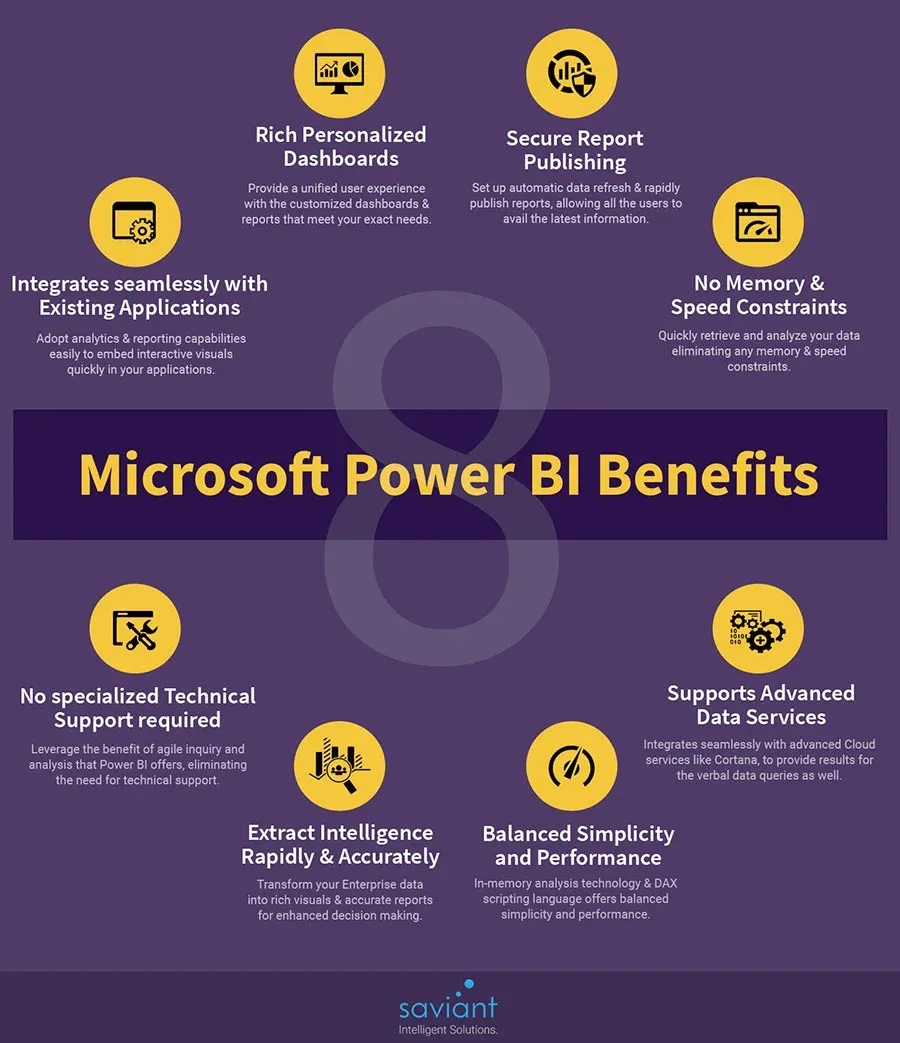
Another big plus is Power BI's ability to blend data from different sources. Imagine mixing ingredients from across the globe into one dish. Power BI does that with data. Excel, databases, web services—you name it, Power BI can likely connect to it and pull it all together.
It also keeps everyone on the same page. Once you’ve created a report or dashboard, you can share it with your team or the whole company. No more back-and-forth with outdated spreadsheets. Everyone gets the latest info in real-time.
Lastly, it’s a huge time saver. Automated reports, real-time updates, and quick insights mean you spend less time digging through data and more time making decisions. It’s like having a fast pass to the front of the line, every time.
So, in short, Power BI makes dealing with data a whole lot easier, connects all your data sources, keeps everyone informed, and saves you a ton of time. Pretty cool, right?
Common Use Cases for Power BI
Power BI is a handy tool for a bunch of different scenarios. Here's where it really shines:
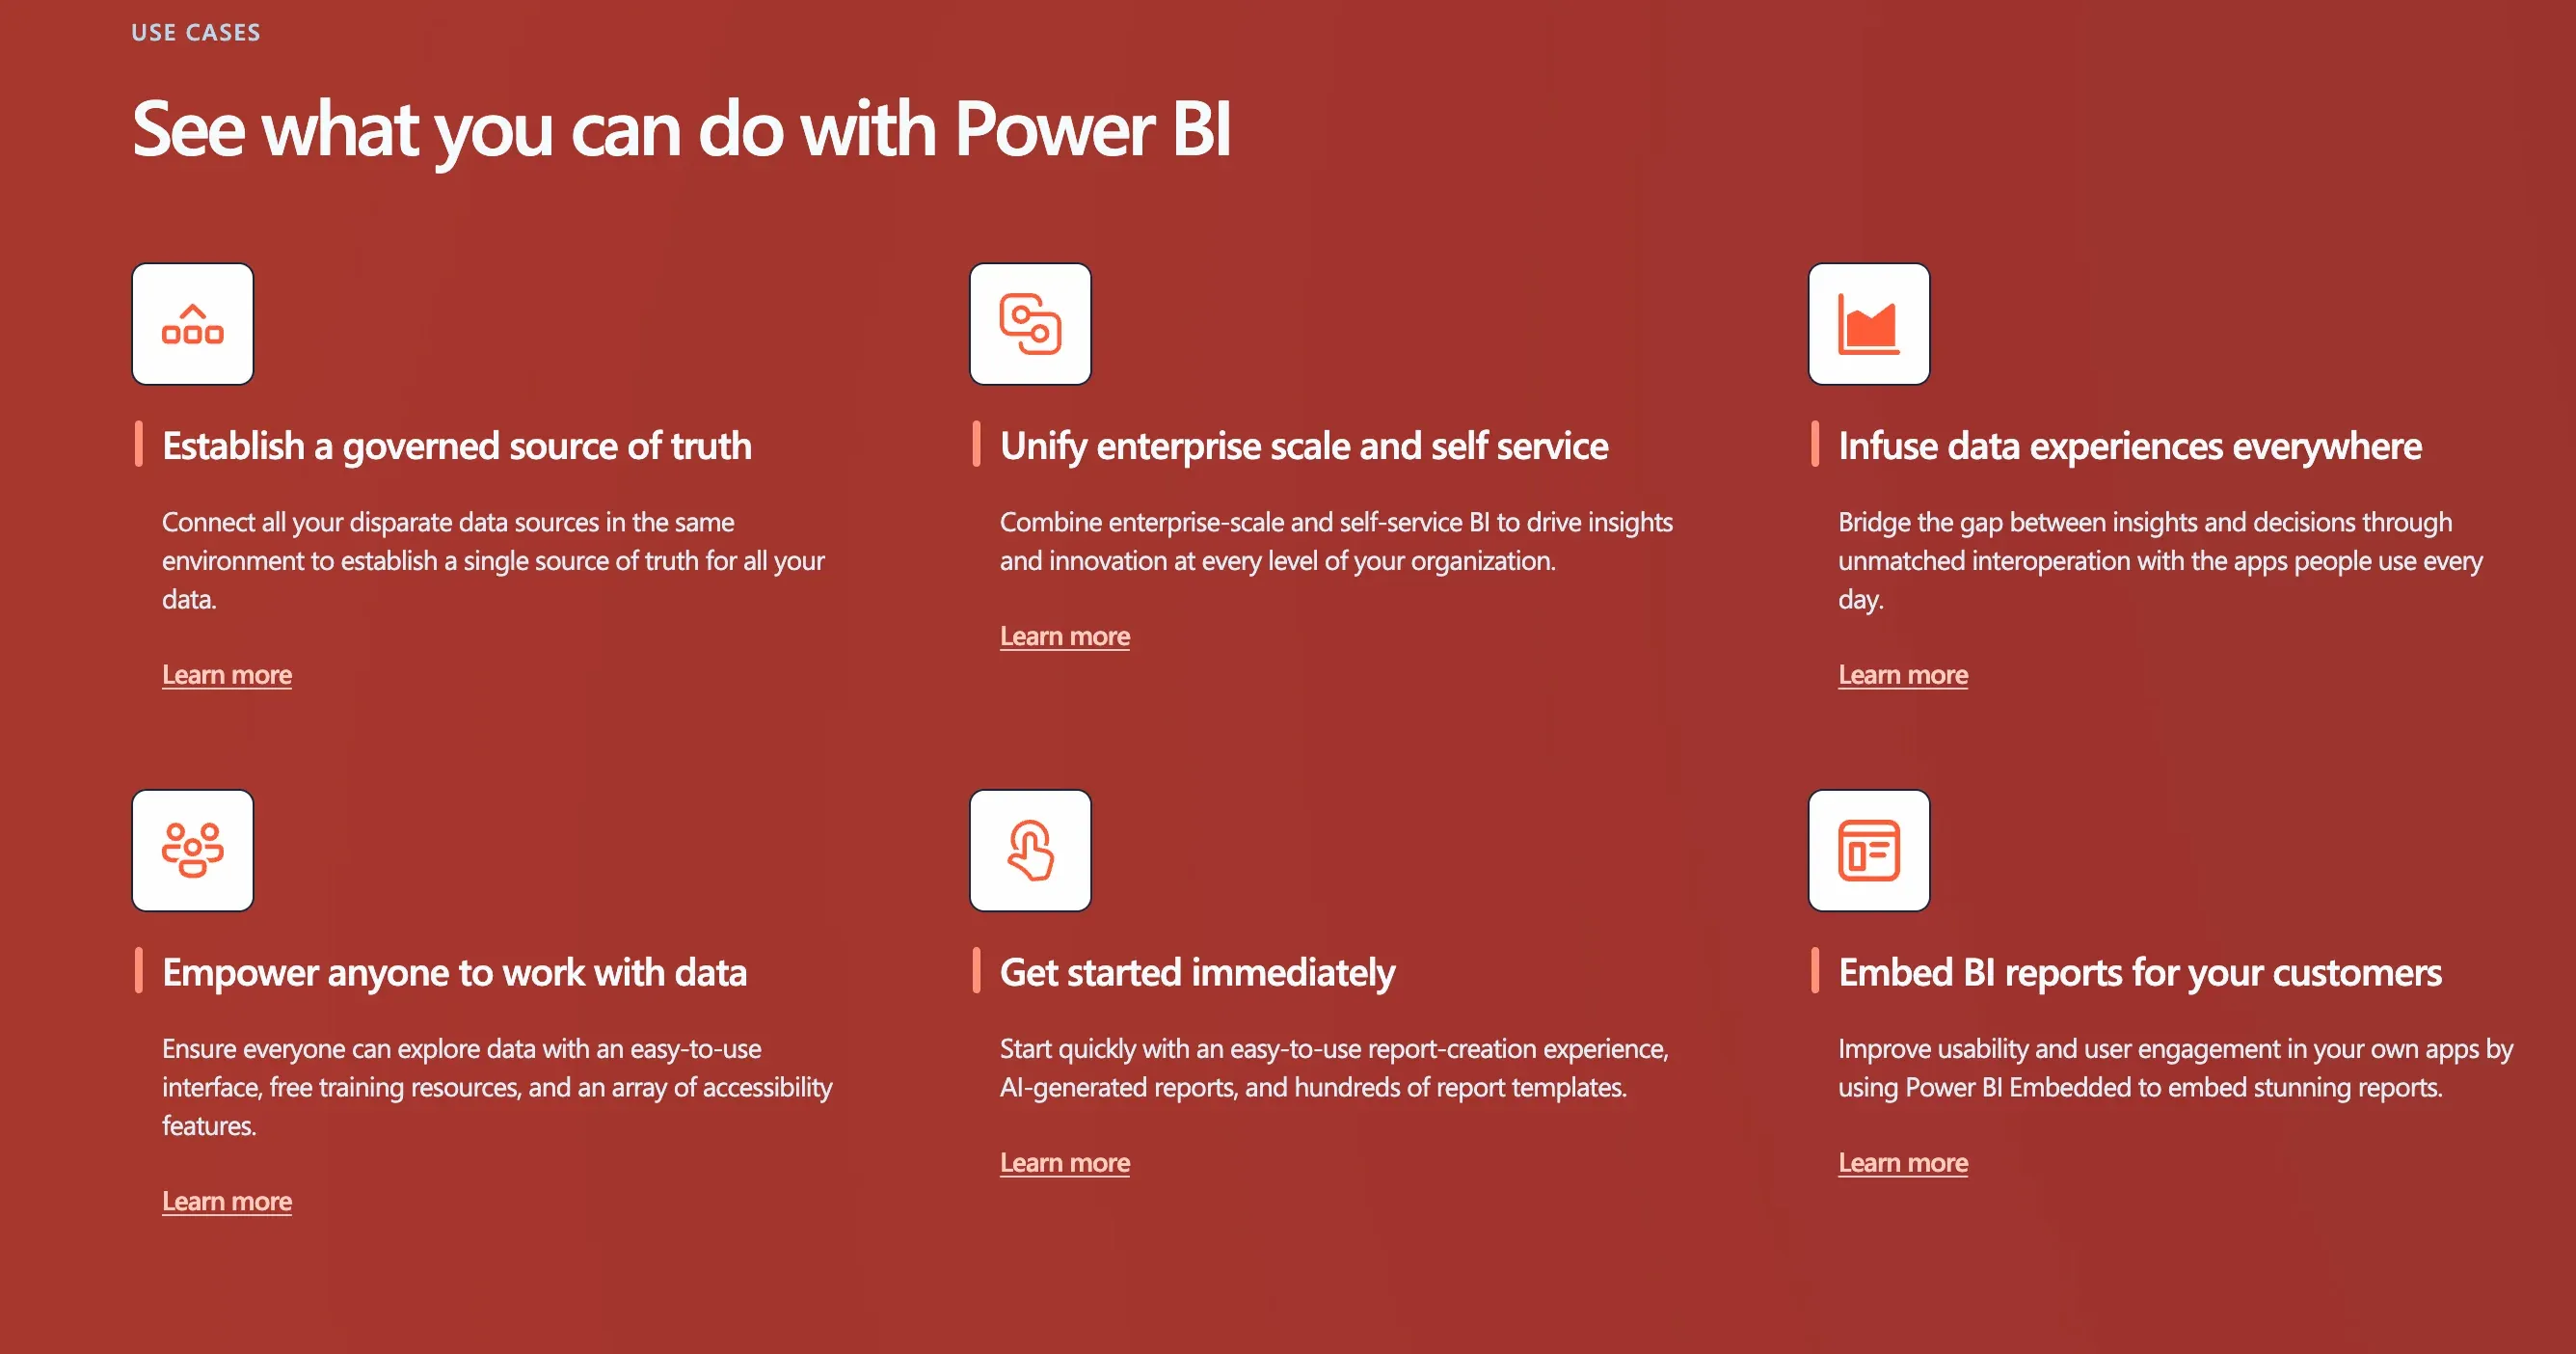
Sales Insights: Imagine knowing which products are flying off the shelves and which ones aren’t. Power BI helps you track sales, see trends, and make sure you’re stocking the right stuff.
Customer Feedback: Want to know what your customers are saying? Power BI can help you sort through feedback from surveys, reviews, and social media, giving you a clear picture of what’s working and what’s not.
Financial Planning: Keeping an eye on the budget and forecasting future costs can be a headache. With Power BI, you can pull in data from various sources and get a real-time view of your financial health.
Project Management: Keeping projects on track is easier when you can see all your deadlines, resources, and progress in one place. Power BI lets you monitor everything at a glance.
Inventory Management: Imagine being able to predict exactly when you’ll run out of stock. Power BI can analyze your inventory levels over time, helping you stay ahead of demand.
In short, whether you're selling products, managing projects, or just trying to get a handle on your data, Power BI has you covered. It’s like a Swiss Army knife for your data needs.
Getting Started with Power BI
Getting started with Power BI is pretty straightforward. First off, head over to the Power BI website and download the Power BI Desktop app. It’s free, which is always nice.
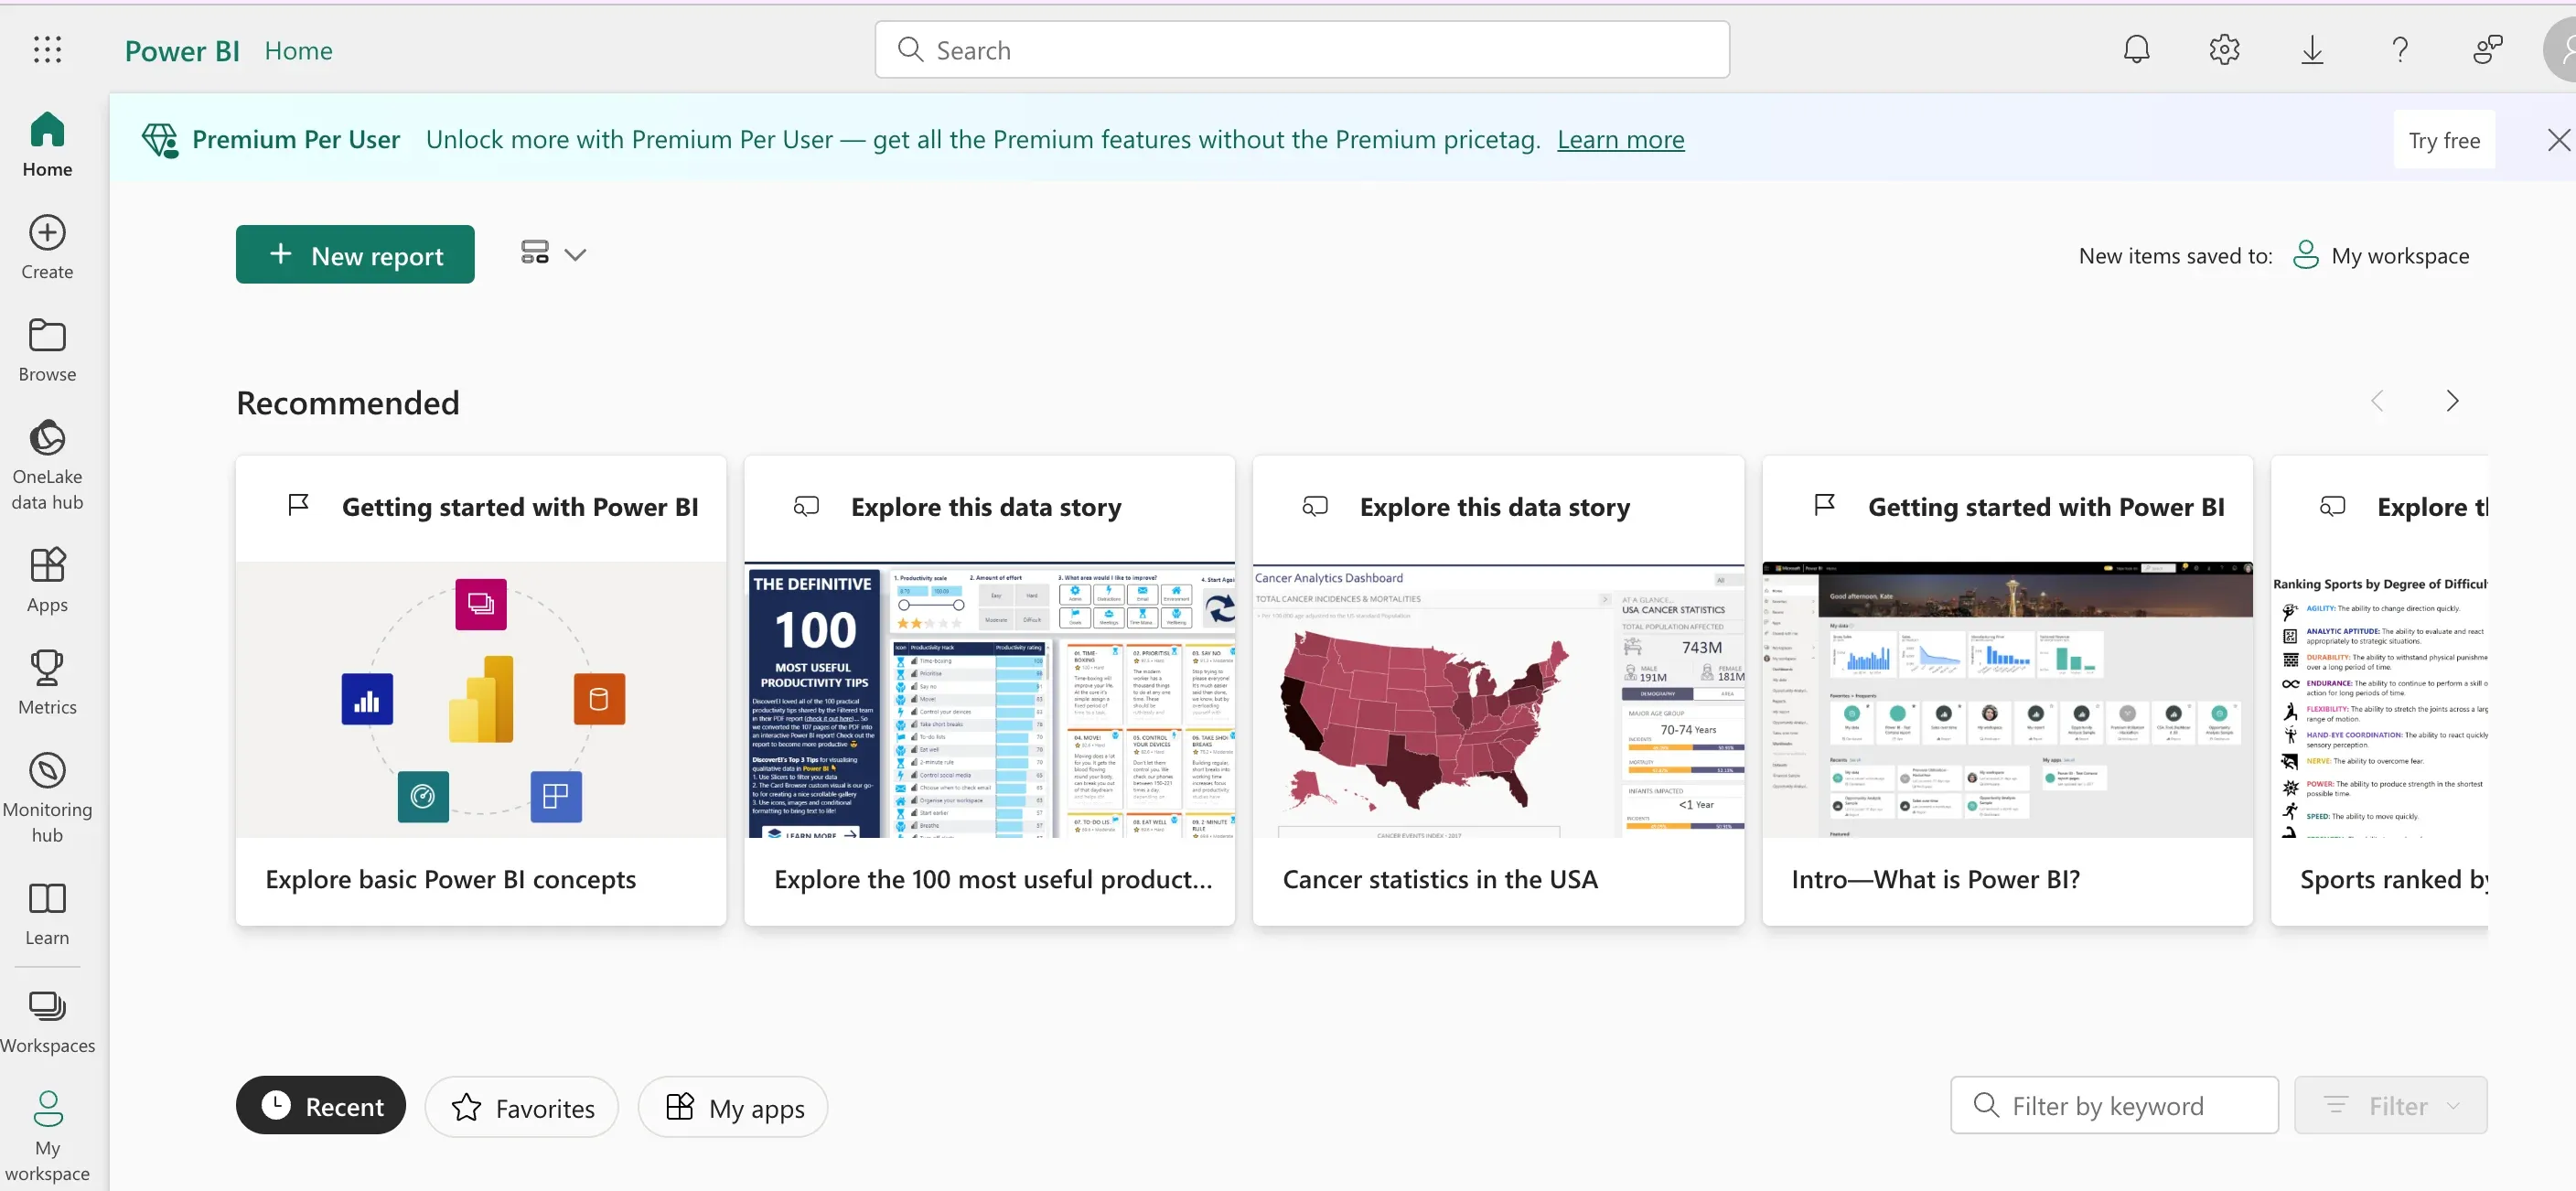
Once you've got it installed, open Power BI Desktop and play around a bit. Start by importing some data. You can use Excel files, databases, or even web data – whatever you have handy. This is your chance to get comfortable moving data into Power BI.
Next up, try making your very first report. Pick a simple dataset to begin with. Look for the ‘Report view’ and drag some fields onto the canvas. Before you know it, you'll have charts or graphs staring back at you. It's easier than it sounds, trust me.
Got a report? Great! Now, share it. Create a Power BI account if you haven't already, and publish your report from Power BI Desktop to the Power BI service. This step lets you share your insights with others.
And... that's basically it. Start with these steps, and you're on your way. Remember, it’s all about experimenting. The more you play with Power BI, the better you’ll get. So, dive in and start turning your data into something cool.
Suggested Reading : Enhance Power BI with Microsoft Copilot AI
Conclusion
So there you have it. Power BI is your go-to for turning heaps of data into valuable insights, without needing a PhD in data science. Whether it’s sales figures, customer feedback, or just keeping an eye on your budget, Power BI can handle it. It’s about making data work for you, in a way that’s easy to understand and share.
Getting started is as easy as downloading the app and playing around with your data. No need to be intimidated. Dive into creating reports and see what your data can tell you. The whole point is to experiment and learn as you go.
Remember, the goal of Power BI is to make your life easier. It’s about saving time, making informed decisions, and sharing those insights with your team. So, grab some data, and give it a whirl. You might just surprise yourself with what you can achieve.
Frequently Asked Questions (FAQs)
Can Power BI integrate with other Microsoft tools?
Yes, Power BI integrates seamlessly with other Microsoft tools like Excel, Azure, and more, allowing for a more streamlined workflow across your Microsoft ecosystem.
Is Power BI suitable for small businesses?
Absolutely, Power BI is scalable and offers various licensing options, making it an excellent tool for businesses of all sizes, including small operations looking to harness the power of their data.
Can I use Power BI on mobile devices?
Yes, Power BI offers mobile applications for iOS and Android, enabling you to access your dashboards and reports on the go.
Do I need an internet connection to use Power BI Desktop?
While you can design reports offline in Power BI Desktop, an internet connection is required for sharing reports through the Power BI service and accessing data from online sources.
